<body leftmargin=0 topmargin=0 marginwidth=0 marginheight=0>


top page, english, japanese


Display bicycle power and Create a FIT file recorded power and speed, etc, without a power meter but a only single smartphone. --

-- Estimation of the actual phase of the track (road alignment) by smoothing function.
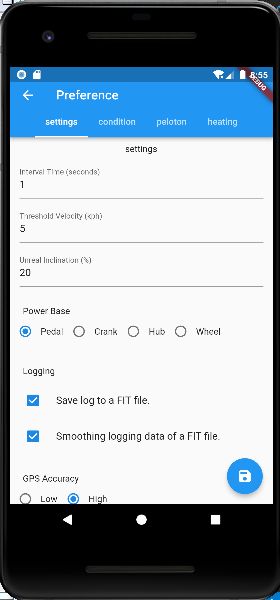
-- Highly accurate power estimation due to detailed profile setting.
-- Multiple profiles can be saved for selective power estimation.
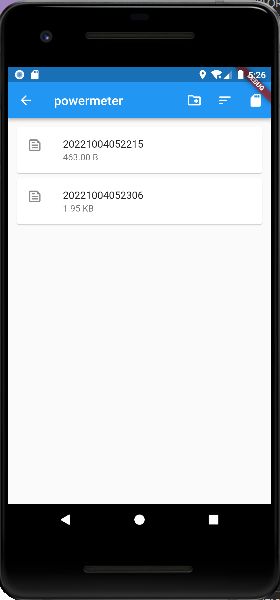
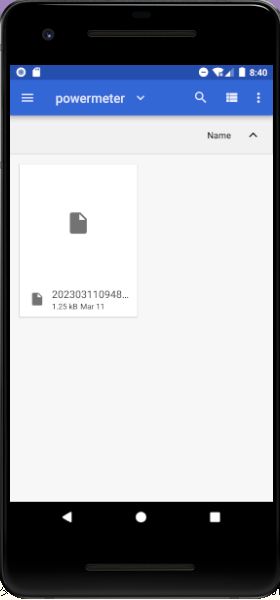
-- GPS log function for power estimation in FIT file format.
-- FIT file can be directly analyzed by the Golden Cheetah and others.
-- Background logging in sleep mode.

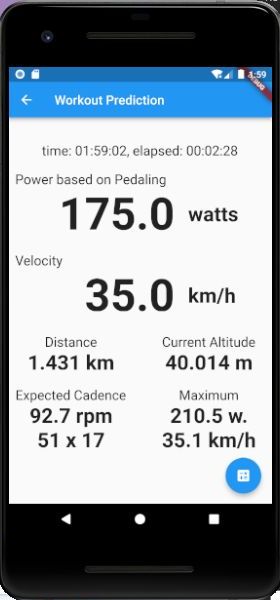
The image on the right is a capture of the emulator (The current version is slightly different), simulating a ride at around 35km/h for 2 minutes and 28 seconds, with appropriate values set every second due to set in the Position data (Geo Coordinates, Altitude).
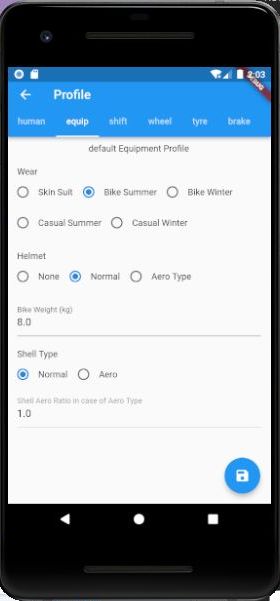
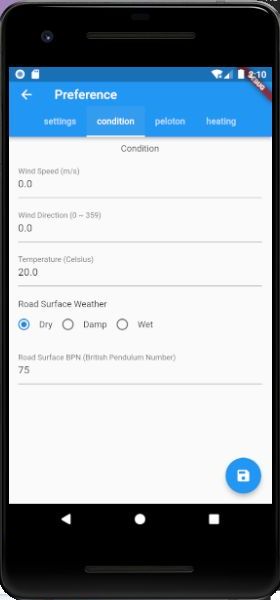
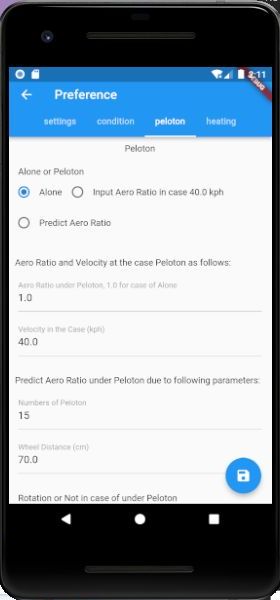
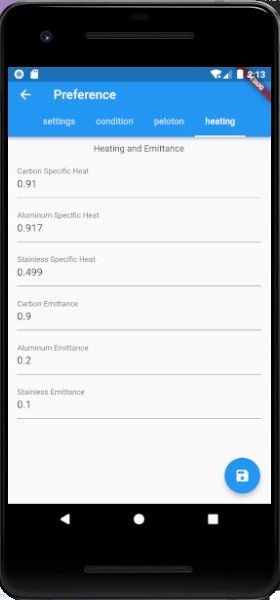
The power estimation is based on very detailed parameters and a huge amount of statistics obtained by the power meter, making it a rigorous and realistic estimation.
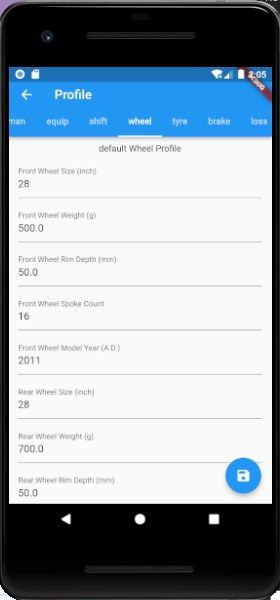
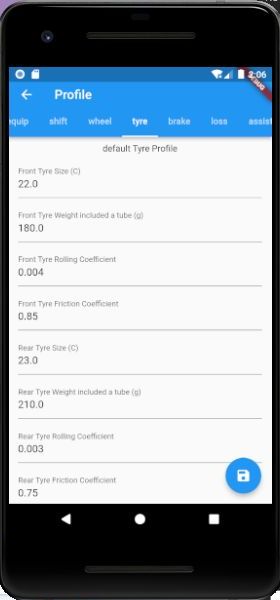
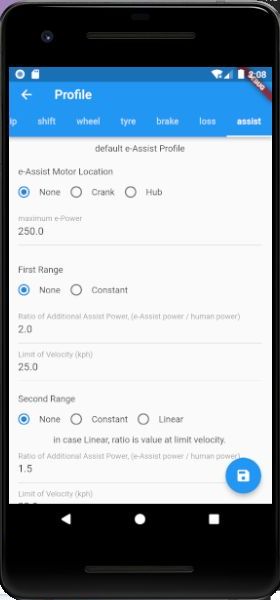
The parameters include human (cyclist) physique and clothing, helmet presence and type, position, and detailed equipment specifications - total weight, frame type, wheel weight, rim weight, rim height, tire size, tire weight, friction and rolling coefficients, number of spokes, number of chainrings and sprockets and their respective tooth counts, electric power assist, etc. - based on the set profile.
Multiple profiles can be registered, so even if you have multiple bicycles or different wheels, you can set up all of them once, including combinations, and call them up selectively.

If there is a problem, it is the accuracy of the GPS and the performance of the GPS chip of your smartphone.
Speed, acceleration / deceleration, and slope are calculated from latitude, longitude, and altitude, and the accuracy of these three calculated values has a great effects on the power estimation

The accuracy of these three calculated values has a great effects on the power estimation. High-precision chips for latitude and longitude seem to be widespread, but high-precision chips for altitude are not so widespread due to the difficulty of the measurement conditions. However, what is important in this case is the value of altitude change, so I think there are many chips and models that can withstand use.
(It may be practically impossible to estimate the power in real time if the accuracy of GPS data is not good.

There is a way to avoid worrying about the error of GPS data.
You can do this by smoothing the data. This is the same method used to remove noise from image files. Since roads are smooth changes to begin with, especially in terms of altitude change, smoothing GPS data is as close as possible to the actual state of the road.

FIT File is a model-independent binary data file format that is very compact and can record a wide variety of workouts.
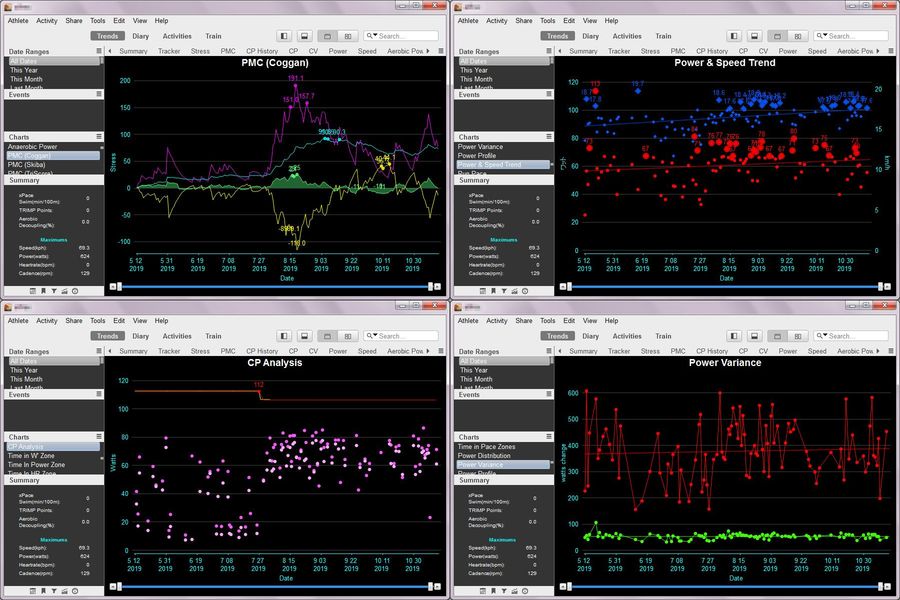
In addition to the above, it is also possible to use FIT File as a standard activity file reader for the Golden Cheetah, a famous training support software based on exercise physiology. Even if you are not a competitive cyclist, if you are a regular cyclist, you may find the Golden Cheetah's analysis and exercise management very interesting. It is a very powerful free software.

I haven't been able to upload to the Google Store yet.

As for Windows, The software cyclingGPSToPowerSim uses exactly the same parameters and estimation method as this application, and can generate FIT files of power estimation from GPS log files.
It also has a full set of simulation functions for power, acceleration and deceleration at constant speed, terminal speed at downhill, braking, etc.
The download page is also a tutorial page.


powermeter for Android, Power display and FIT file creation with a single smartphone
ver.0.00.00, last updated on --th ---- 2022 since --th ---- 2022
 
Usage Summary
 
1. Profile
2. Preference
3. Workout, FIT File
4. File Check
5. GoldenCheetah
 
chapter1: Profile
 
1-1. Human
1-2. Equipment
1-3. shifting
1-4. Wheel
1-5. Tyre
1-6. Brake
1-7. Loss of Power
1-8. e-Assist
 
chapter2: Preference
 
2-1. Settings
2-2. Condition
2-3. Peloton
2-4. Heating
 
chapter3: Workout, FIT File
 
3-1. Realtime Power Display
3-2. FIT File Creation
 
chapter4: File Check
 
4-1. Directories
4-2. Stats of A File
 
chapter5: GoldenCheetah
 
5-1. Validation of the Analysis
5-2. ****


Usage Summary


The image on the left shows you tapping the menu icon in the upper left corner after first boot, and there is only one profile, "default".
Tap "default", then tap "Edit" in the submenu shown in the right image, and replace all the items on each page of the profile with your own body size and equipment specifications. You can also leave "default" as it is and tap "Create a New Profile" to do the same thing.
You can add new profiles by tapping "Create a New Profile". If you no longer need a profile, you can delete it by tapping "Delete", provided that you have more than one profile.

There are 8 pages in one profile, and you need to set all the items in each page to your own.

- Human
- Equip
- Shift
- Wheel
- Tyre
- Brake
- Loss
- e-Assist

Each page is described in detail in Chapter 1.


Tapping on "Preference" will bring up a submenu with only "Edit." When you tap "Edit", you will see the following four pages. Except for the first page, "Settings," you don't need to change much.
Once you make changes (save them), they will be reflected the next time you start the program.

- Settings
- Condition
- Peloton
- Heating

Each page will be explained in detail in Chapter 2.


Tap "Workout" in the profile menu to go to the power display page.
It also shows speed, distance, altitude, expected cadence and gear selection, max power, and max speed. The altitude is shown because it seems to be an indicator of GPS accuracy.

The blue button on the bottom right is the Start / Stop button. Tap it to start the display, and tap it again to end the display.
(Real-time power display requires a highly accurate GPS chip.)

If you have set up a log in "Settings", it will create a FIT file at the same time.

The Background Service is activated while the measurement is in progress,

See Chapter 3 for details.


Tap File Check in the menu to bring up the sub-menus Directories Check and Stats of A File.

Tap Directories Check to start the File Manager and check the contents of the powermeter directory, so you can see the FIT files that have been created.

Tap Stats of A File to move to the page displaying statistics, and tap the button at the bottom right to start the File Manager and select a file. When you select a file, the statistics (summary data) for that FIT file will be displayed.

See Chapter 4 for details.


The output FIT file can be analyzed by the Golden Cheetah or other physiology softwares.
By analyzing exercise physiology, you can manage your training. Even if you don't have a training mindset and are just riding for health or fun, it will be interesting to see how your fitness and physical condition changes.

The idea is to use the Golden Cheetah as a test. Here is a brief description of the general process of using it. This is just a brief description to help you get an idea of what to expect.

Data collection
-- Record all the data when you ride your bike.
-- Collecting data for more than 6 weeks to ensure reliability

Importing data
-- Download and install the Golden Cheetah.
-- Set "Athlete"
-- If you don't know FTP, leave it as default.
-- Import FIT files from the "Activity"/"Import data" menu

Analysis and evaluation
-- Measure CP and FTP periodically and register them. This will be the evaluation standard.
-- Evaluate CTL, TSS, ATL, and TSB with PMC (Performance Management Chart).
CTL : Chronic Training Load, Physical Fitness Index
TSS : Training Stress Score, Training Load
ATL : Acute Training Load, short-term physical fitness index
TSB : Training Stress Balance, Fatigue Level
-- Training can be optimized by maintaining the above balance.
-- If you are a competitive athlete, you can maximize and optimize your physical performance by adjusting the way you prepare for competitions.

For more information on how to use the Golden Cheetah, please visit the following websites
-- UG_Main-Page_Users-Guide
-- This manual is for Golden Cheetah, version 3.0., Copyright (c) 2013 Mark Liversedge


chapter1: Profile


human body and ability

-- human height
-- human weight
-- position, or torso angle
-- cadence usual
-- cadence powered maximum
-- cadence shift up
-- cadence shift down

Enter the human's height and weight

Select a position. If you select "input Torso Angle", you can substitute the position by entering the average angle of your back muscles.

In the case of a road race, the cadence is the one you would use if you were running at a constant speed, which may be interpreted differently by different people. In a road race, it is the cadence when you are riding in a group without any particular tactics.

The cadence of the maximum power is the cadence at which the maximum power is output. It is the cadence at which an individual is traveling at maximum speed. In a race, it is the cadence of a goal sprint.

The shift-up cadence is the cadence just before shifting up.

Shift-down cadence is the cadence just before downshifting


Main specifications of the equipment

-- wear
-- helmet
-- bike weight
-- shell type
-- shell aero ratio

Choose your clothing and helmet. It affects aerodynamics. Especially clothing has a big impact.

Enter the total weight of the bike.

Shell type refers to the type of frame shape, normal or aero. If the bike is aero, you can also enter the aerodynamic ratio compared to the normal type. The influence of the frame is not so big.


shifting

-- time loss of shifting
-- crank length
-- chainring count
-- sprockets count
-- chainring teeth
-- sprockets teeth

The time loss in shifting is the time loss in shifting. For example, in the 2010 model year, the Campagnolo record was said to be 0.35 seconds and the Shimano Dura Ace 0.45 seconds. The time set here is no power when shifting in the simulation (acceleration / deceleration). Since manufacturers are aiming for seamlessness through the development of sprocket shapes, more and more people may be applying power when shifting, whether more or less. In that case, a shorter time would be better.

Enter the length of the crank

Enter the number of chainrings. Enter the number of teeth on each chainring according to the number of chainrings.

Enter the number of sprockets. Next, enter the number of teeth on each sprocket.

The maximum is 3 front x 15 rear, the minimum is 1 x 1 (pist).


Set the following items for the front and rear wheels.

-- size
-- weight
-- rim height
-- spoke count
-- model year

Enter the size of the wheel. The unit is inches.

Enter the weight, without tires and tubes.

The wheel's rim height, number of spokes, and model year can be used to estimate aerodynamics.
This calculation is based on a model equation consisting of three factors that were found to be significant after statistical processing of dozens of actual wheel data. The high significance of the model year reflects the evolution of aerodynamics in the mid '00s.


Set the following items for each of the front and rear tires

-- size
-- weight
-- rolling coefficient
-- friction coefficient

Enter the size of the tire. The size is the width of the tire. This is usually represented by the letter "C", but it may vary slightly from manufacturer to manufacturer.

Enter the weight. Include the weight of the tube.

Enter the rolling coefficient.
In the high-end class, it is mostly distributed around 0.003 to 0.005. This is for a typical paved road with a BPN of 75. Dirt surfaces are not taken into account. In general, the coefficient tends to be lower for slick tires.
Cyclocross and MTB tires, which are specialized for dirt roads, have extremely high rolling resistance, but they are unique in that their coefficient does not change much whether the road is paved or rough.

Enter the coefficient of friction.
In the high-end class, the coefficient is mostly distributed around 0.70 to 0.90. This is also the case for a typical paved road with a BPN of 75. Dirt surfaces are not taken into account. In general, slick tires tend to have a higher coefficient.

There is a trade-off between the coefficient of friction and the coefficient of rolling, with some users using tires with a higher coefficient of friction on the front and tires with a higher coefficient of rolling on the rear. It all depends on the brand.


Set the following items for each of the front and rear brakes

-- rim / disc (type)
-- material
-- weight
-- depth/diameter

First, select whether you want to use rim brakes or disc brakes.

Select the material. You can choose carbon, aluminum, or stainless steel. For rim brakes, you can choose carbon or aluminum. For disc brakes, you can choose either aluminum or stainless steel.
(Carbon disc brakes are rare, but we are not considering ceramic coated carbon composites here.

Enter the weight of the rim or rotor

Enter the height (rim depth) for the rim and the diameter for the rotor.


Set the power loss for the following three instruments. In all cases, a typical value is around 3-5% under default torque conditions.

-- shell loss
-- mission loss
-- wheel loss

The shell loss is due to the flexing of the frame. Enter the loss rate when the crank torque is 50.0Nm. The loss ratio will vary depending on the torque.
If you have a very stiff frame, you can use 2.0% or 1.5%. This is just the mechanical power loss, it does not mean that it is not fatiguing.

Transmission loss is the loss in power transmission. 3.0% for high end components and 5% for low end components would be good.

Wheel loss is due to rear wheel flex, enter the loss rate for a torque of 20.0Nm. The loss rate will vary with torque.
Different wheel types have different loss rates. One indicator is the number of spokes on the sprocket side of the rear wheel.


Electric Assist

First, set the position and maximum power of the motor.
Next, set the type of assist, end speed (speed range), and assist ratio for up to three ranges.
Normally, two ranges will be sufficient. If you don't need any ranges, set them to "none".

Select the type from "constant" and "linear".
For "constant", the output of the motor is determined by a constant magnification relative to the human power, and for "linear", the magnification varies linearly. With "linear", the magnification changes linearly according to the speed, from the end magnification of the previous range to the set magnification at the end speed of the range in question.

The speed to be specified is the terminal speed (kph, km/h) of the respective range.

The ratio is motor power divided by manpower. For example, if the ratio is 2.0, you can expect three times the power of human power and motor combined. Of course, it is impossible for the motor to exceed its maximum power.

For example, if we follow the EU regulations for electrically power assisted bicycles
The maximum power of the motor is 250W, and the first range is constant, up to 25km/h, at a ratio of under 2.0 times. After the second range is none. The ratio depends on the mode and brand, etc.


chapter 2: Preference


Settings

-- interval time
-- threshold velocity
-- Unreal Inclination
-- power base (pedaling / crank / hub / wheel)
-- save log to a FIT file
-- smoothing logging data of a FIT file
-- GPS Accuracy

Set the interval in seconds for displaying and recording power.

Set the speed to exclude from recording. If the speed is less than the speed specified here, no record will be created. For example, if you are waiting at a traffic light or getting off the bike, the data will not be recorded. 0.0 will record all data.

Set the unreal inclination. Records with a inclination (%) greater than the value entered here will be ignored.

Select the power base to be displayed and recorded.
Each power output is different according to the power loss of the equipment. In the case of electric power assist, the power of each base will vary greatly depending on the position of the motor.
Normally, you will want to display and log the human power by selecting "pedaling".

Check the "save log to a FIT file" checkbox to create a FIT file. If unchecked, only the power will be displayed and no FIT file will be created.

Check the "smoothing logging data of a FIT file" checkbox to eliminate GPS data errors. If unchecked, outliers may be recorded depending on GPS accuracy.

Recommend to set the GPS accuracy to High.


Course Condition

-- wind speed
-- wind direction
-- temperature
-- road surface
-- BPN

Enter the wind speed and direction.

Set the air temperature. The temperature and altitude are used to calculate the air density, which is a fundamental parameter for aerodynamics.

Set the road surface condition.
Sets the rainfall condition. Select from dry, dump, or wet.
BPN is a unit of measurement called British Pendulum Number, which is a rating value for surfaces that provide sufficient friction.

Unless the conditions are extreme, it is unlikely that you will need to change this settings.


Sets the air drag rate on the proton or train.

-- alone
-- input ratio
-- calculate

If you are running alone, select Alone and set the air drag ratio to 1.0.

There are two ways to calculate the air drag rate: by entering the rate directly, or by calculating it from the number of bikes in the group and the distance to the bike in front.
When setting the rate directly, you must also set the speed as a condition.
If you want to let the software do the calculation, you can select whether or not to have the rotation pulled by the train. If you choose to participate in the rotation, an averaged air drag rate will be calculated.

The only time you can use this setting is in a team TT in guessing.


Set the specific heat and emissivity of the brake material. The specific heat and emissivity of the brake material can be set separately for each of the following three types of materials

-- carbon
-- aluminum
-- stainless

This data is used as the basis for calculating the temperature of the brake selected in the equipment settings of the profile.

Basically, there is no need to change it. Please set it only if you are using a slightly special material.


chapter 3: Workout, FIT File


When you tap the profile you want to select, the sub-menu shown in the left image will appear, and tapping "Workout" will take you to the page shown in the right image. At that point, all the values are set to zero.

The blue button at the bottom right is the Start / Stop button.
Press the button to start the measurement, and press the same button to stop the measurement.

You can output a FIT file by checking "Save log to a FIT file" in the "Settings" section of "Preferences".
In this case, it is important that you press the blue button to stop the process. If you do not do so, the FIT File will not be output if the page is moved.
If you uncheck "Save log to a FIT file", only the real-time power will be displayed and no FIT file will be created.

The Background Service is activated while the measurement is in progress, and everything works even if another app is in the foreground or the smartphone is put to sleep, allowing the creation of FIT files and not affecting the distance or average speed when re-displayed in the foreground.

The FIT File will record all the records from start to stop in one file. The name of the file is a string of numbers with the start time, date, time, minute, and second. The file extension is ".fit".
By repeating the start and stop, multiple FIT Files will be created in the storage.
There will be no need to record when you are getting off or taking a break. And if you want to combine multiple files into a single file for a day, we recommend combining them with the aforementioned "CyclingGPSToPowerSim".


If you check "save log to a FIT file" in "Settings", it will create a FIT file as soon as it is displayed. You can also check "smoothing logging data of a FIT file" to keep an accurate record of your GPS data, even if it is not so accurate.

The FIT file will be managed on your computer. In other words, you need to be able to import and delete it easily from your android phone.

The FIT file is created in a folder named "powermeter" in the external root.


chapter 4: File Check


Tap Directories Check to start the File Manager and check the contents of the powermeter directory, so you can see the FIT files that have been created.

You cannot select files, etc. You can only check the contents of directories.
Press the Select button to return to the home page.


Tap Stats of A File to move to the page displaying statistics, and tap the button at the bottom right to start the File Manager and select a file. When you select a file, the statistics (summary data) for that FIT file will be displayed.

The FIT file opened in the right image was created using an emulator, so it does not contain any driving data, so the value of each stat is zero.


chapter 5: GoldenCheetah


Let's examine the results of the Golden Cheetah chart, or analysis.
The data shown below is a FIT file created by cyclingGPSToPowerSim from data recorded by a GPS logger. (The parameters and estimation method for the power estimation are exactly the same as in this application.


The image on the right shows some charts that were created by analyzing and estimating power and cadence from GPS data using cyclingGPSToPowerSim for about 6 months, and then importing and analyzing the data with Golden Cheetah.

I was not able to ride much in July because of the rainy season, and I rode intensively in August, but I did not have much chance to ride in September and October due to various reasons.
The data is not good ability enough to use Golden Cheetah, but it is the data of fun ride, so please forgive me...
I was hoping to get the CTL value to 100, but it stalled just before that. It is a little difficult to maintain CTL when you are lazy, and once it goes down, it is impossible to get it back up again unless you want to.
Of course, it is important to regularly analyze and register the exact CP and FTP. If you don't, the CTL can easily go over 100.

One of the most reliable charts is the "Speed Trend" of "Power & Speed Trend", because Speed is calculated from Geo-coordinates.
Speed is calculated from Geo-coordinates, and the "Power Trend" is similar to Speed in terms of time series changes.
It is also similar to the CTL of "CP Analysis", "Power Variance", and "PMC". Although not shown in the image, other charts such as "Aerobic Power" and "Anaerobic Power" also show similar changes.

We can see that these data are more than sufficient for the purpose of Golden Cheetah, which is to evaluate and manage training based on exercise physiology.
In fact, the changes in CTL (Chronic Training Load) are quite accurate as a fitness index. Also, when I felt that I had gained some strength, my average speed and power output went up without me even being aware of it.

Perhaps if you check the individual Fields values of all the Records, you might find some oddities in the altitude and its changes. Of course, outliers as slope have been removed. And even so, for the purpose of "exercise physiology-based training evaluation and management," it is perfectly fine.

Of course, what I hope is that ultra-accurate GPS loggers will become more readily available. If this happens, the data will be comparable to that of a power meter.


****


please post any impressions you may have


e_mail to webmaster